|
Graphical Network Editor Component
The Graphical Network Editor (GNE) component can be used for creating and
displaying simple flat schematic, workflow or topology diagrams. It
uses simple drag drop operations to let users easily create diagrams. The
GNE consists of a set of user defined defined palettes and a graphical canvas in
which graphical objects are rendered. The canvas is a datawindow object
and therefore is restricted to those graphic types that can exist on a
datawindow. Properties and user defined data for objects rendered on the
canvas reside in a datastore that users can extend to hold data particular to each
object. This datastore also contains expressiona that aid in generating
rendering properties for objects on the canvas. Business uses of the
GNE datawindow component include the following...
- Network mapping
- Facilities mapping
- Process mapping
- Wiring diagram
- Pipeline diagram
- Workflow
|
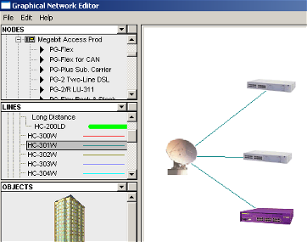 
GNE component showing the user define node,
connections and objects lists
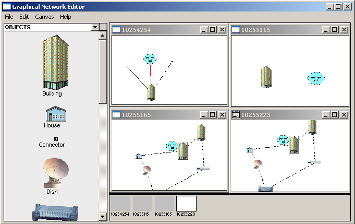
GNE component showing multiple open graphic canvases and the graphic canvas
selector at the lower part of the screen.
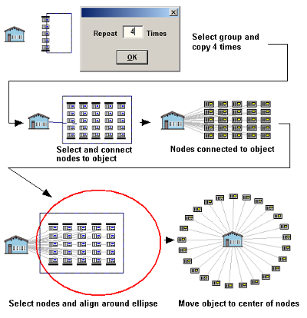
Series of shots from the GNE component showing group selection and group copy
and move, connect and alignment.
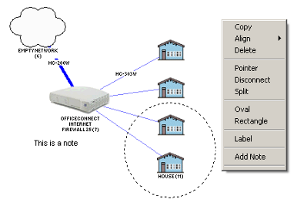
Other
GNE features displayed including labels, the Oval object and user defined notes
and other options available on the drop down menu
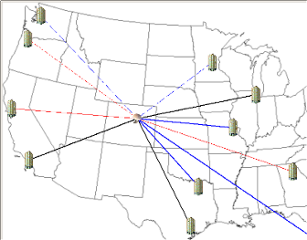
GNE showing object overlaying a background image
|
|
Some of the user defined parameters.
Objects, Nodes and Connectors:
Users can define a palette of objects, nodes and connectors. Nodes are
small images no larger than 16 x 16 that are presented on a treeview.
Objects are larger images and connectors are line objects that normally connect
objects and nodes.
|
|
Information Generated:
For each object, node or connector rendered an optional label is generated on
the canvas describing the object. A row is generated in a datastore that
contains all the rendering properties as well as a row in a datastore that
contains user defined data for the object rendered.
Data rendered on the GNE component can automatically be fed into an
associated report.
|

