Information:
The Appointment component uses a technique in which detail row based data is rendered over many rows, yet appears to be a single object.  This gives the ability to scroll vertically and horizontally


Organization Chart Component

The Organizational Chart (Org Chart) component can be used for creating and displaying hierarchical or organizational charts.  It uses simple drag drop operations to let users easily create org charts.  The org chart consists a user defined palette of objects that can be added to the chart and a graphical canvas in which graphical objects are rendered.   The relationships in the org chart are determine by the location were each node is dragged to on the graphic canvas and its relationship to surrounding objects.  Once an object is dropped onto the canvas, the relationship is determined and loaded into a datastore and the org chart is redrawn with the new relationship.

Business uses of the GNE datawindow component include the following...

  • Organization charts
  • Any type of other hierarchical diagram

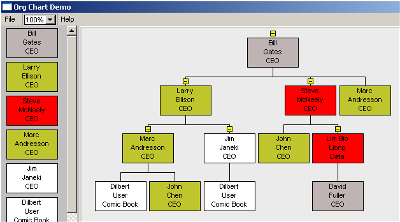
Org Chart component showing the user defined palette on the left and the graphic canvas containing the chart.


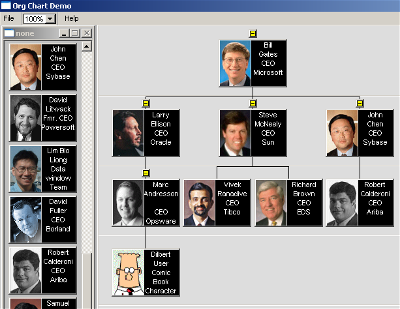
Another version of the org chart component showing images associated with each node of the chart
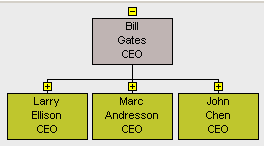

Org Chart showing the three objects on the second level have been collapses as indicated by the [+] on the yellow buttons.

Org Chart objects:

Users can define a palette of objects to be added to the org chart.  Objects can be simple text boxes or sophisticated combinations of text and images.  Performance in rendering the org chart is partially determined by the complexity of the objects displayed.  The more complex the object the slower the performance.

Features:
  • Simple mouse move of objects and from the palettes to the canvas and also within the canvas.
  • Connections automatically generated depending on the location of the object when it is dropped
  • Branch select.  Selecting an object also selects all child objects.
  • Move, copy and delete of node.  Functions performed on parent nodes will affect all child nodes. 
  • Zoom in and out
  • Infinite sized graphic canvas.  You can move the canvas around with the mouse using a viewport much like a Acrobat reader
  • Collapse and expand branches

Information Generated:

A row is generated in an internal datastore that contains all the rendering properties as well as relationships for all objects in the org chart.  Expressions within this datastore compute positional properties of the objects and lines on the org chart.

Data rendered on the org chart component can automatically be fed into an associated report.