|
Stock Chart Component
The stock chart component allows you to add simple stock chart reporting to your application. The stock chart
component uses the metadata datawindow technique to store and render the price and volume data. Each stock chart is a row
in a datawindow and additional columns can be added to the datawindow to make a report. The stock chart component can
be the basis for other specialized business charting. Stock chart types include...
- Line Chart
- Point Chart
- Point and Line Chart
- Candle Chart
Features:
- Multiple types of charts available
- Price lines automatically adjust for the difference in minimum and maximum prices
- Additional report columns can be added to the stock chart.
- The size and location of the stock chart can be set at run time to fit your reporting needs.
- Zoom in and out
- Stock chart can be the basis for other types of business charting
|
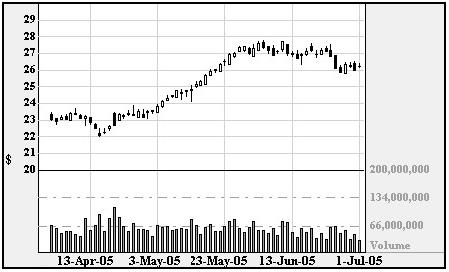 
Stock chart showing the candle chart with 90 days of stock prices.
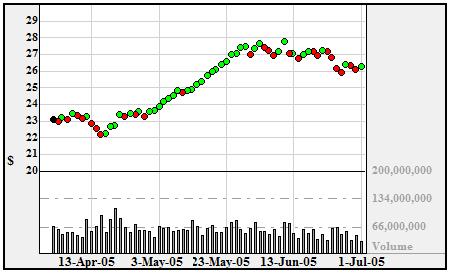
Stock chart showing the point chart type
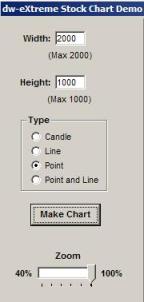
Options included with the demo allow you to select the chart to display along with the charts size. The datawindow
zoom function is also available
|
